How reports and analytics work
Reports help you understand how your business is performing and where you earn the most.
This is not just a viewing tool, but a decision-making tool.
What reports show
Reports contain information about all your bookings, clients, and revenue.
- number of bookings over a period;
- revenue;
- workload of masters;
- popular services;
- client behavior.
What you can analyze
Revenue
How much you earned per day, week, or month.
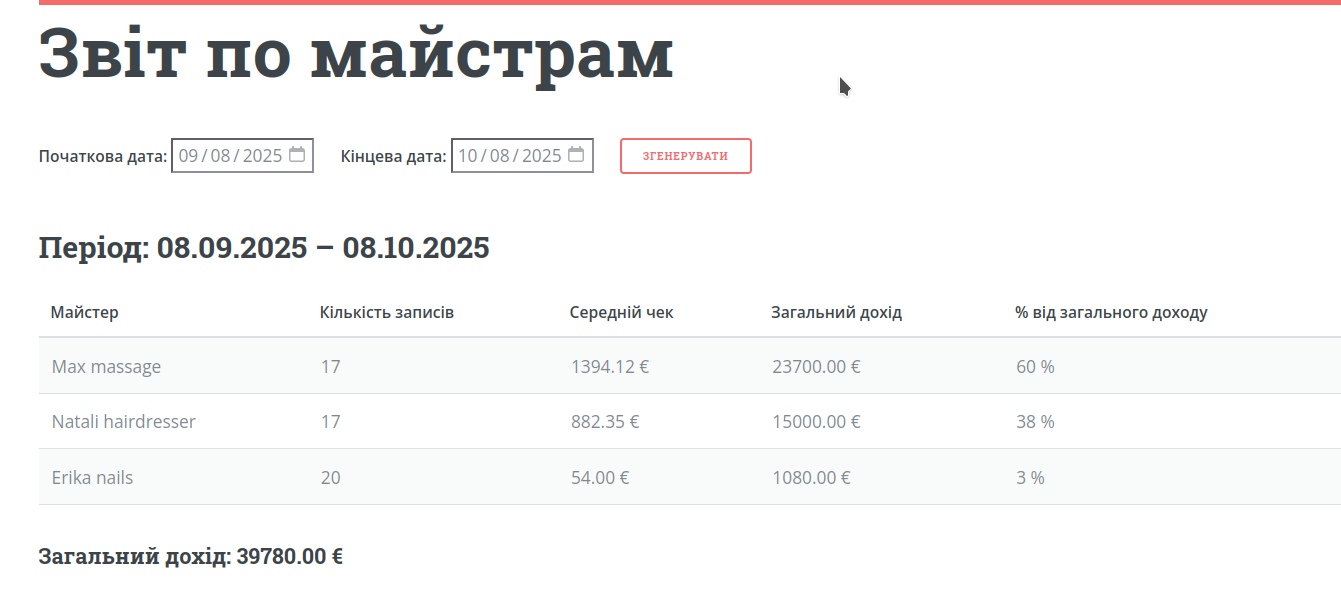
Masters
Which masters generate the most bookings and revenue.
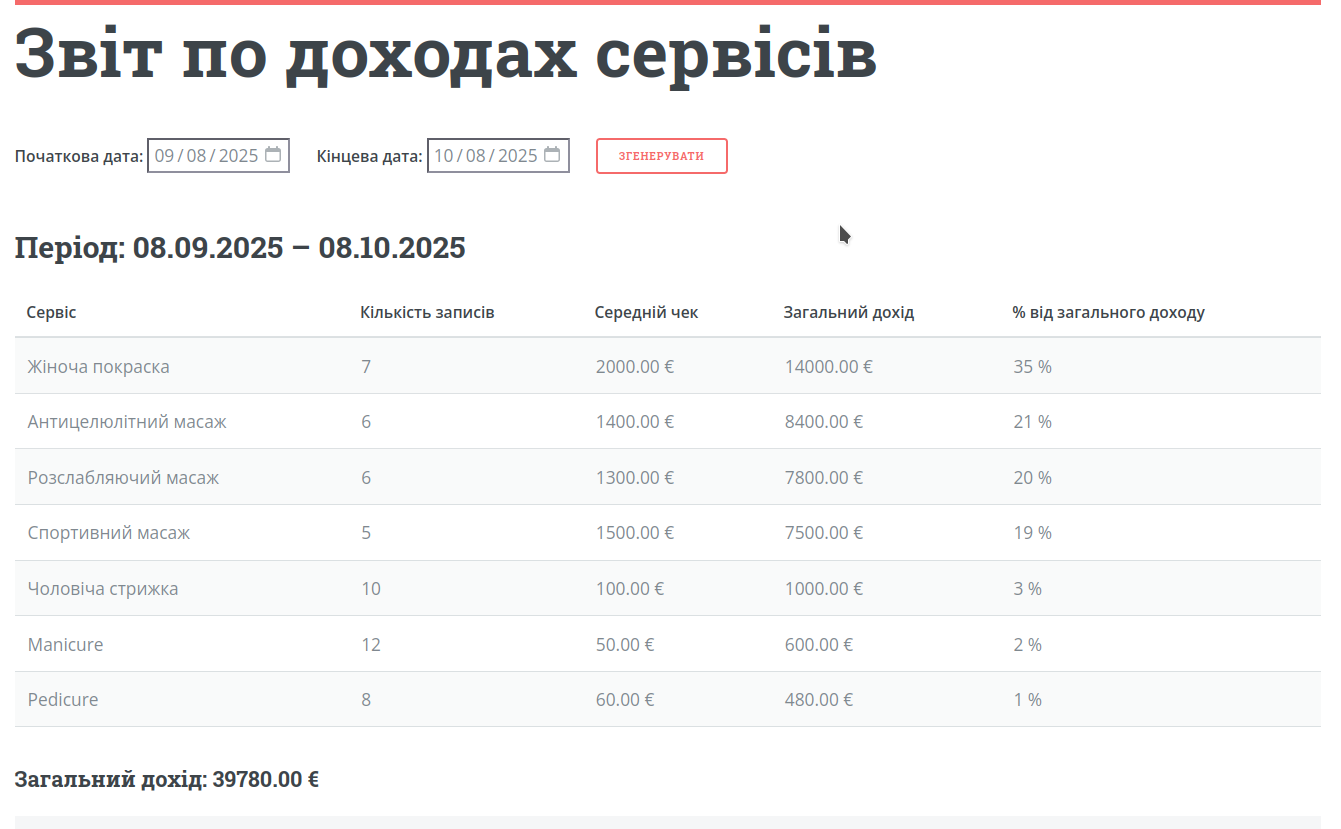
Services
Which services are most popular and booked most often.
Clients
Who comes regularly and who often cancels or does not show up.
How to use reports
Step 1. Choose a period
Set a date range: day, week, or month.
Step 2. Review key metrics
Check the total number of bookings and revenue for the selected period.
Step 3. Drill down
Break down data by masters, services, or clients.
Step 4. Make conclusions
Identify what works well and what can be improved.
How it helps
More revenue
You can see which services are worth developing.
Better control
You understand how masters perform and how busy they are.
Fewer client issues
You can identify clients who frequently cancel or do not show up.
Useful tips
Check reports regularly
At least once a week to track trends.
Compare periods
For example, this week vs last week — it gives better insights.
Look beyond numbers
Analyze reasons: why one service is popular and another is not.
What’s next
Now that the system is fully set up, the next step is to understand how to get your first clients and start actively using online booking.